Press
The used car market, counted from what dealers publish.
Every figure here is from an issued report, carries what it counts, and is free to quote with attribution. Ask Taj Dutton at taj@spotlot.io.
The latest figures
From the weekly market report for 28 September – 4 October 2026, issued 5 October 2026 and never rewritten · the report · its PDF
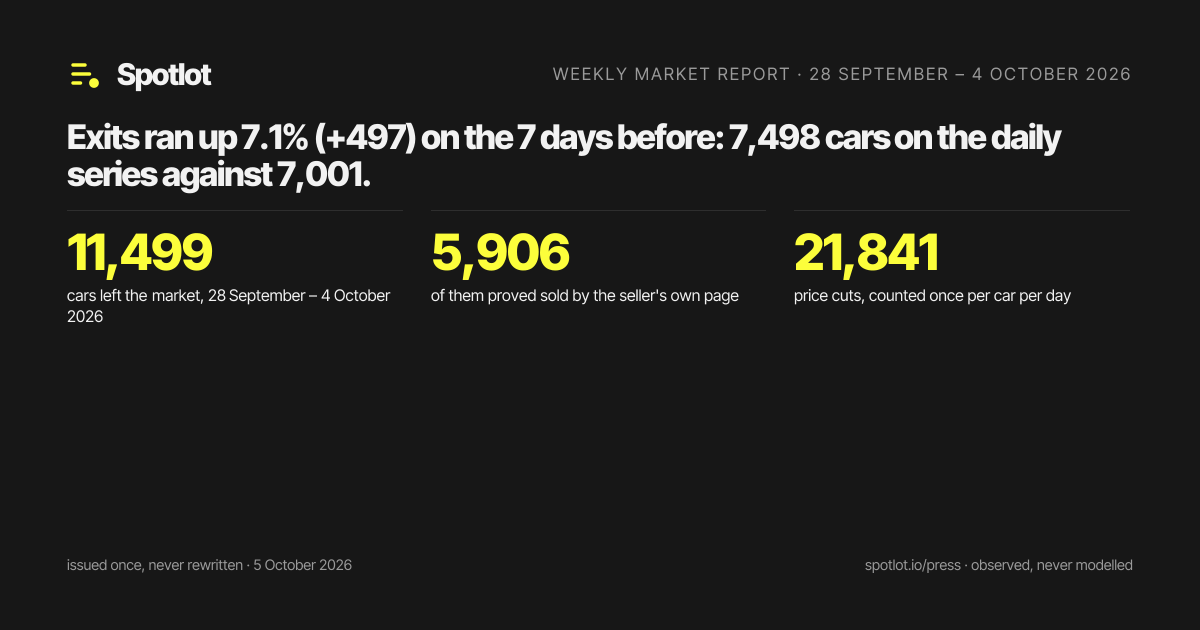
Exits ran up 7.1% (+497) on the 7 days before: 7,498 cars on the daily series against 7,001; at least 5,906 of the week's 11,499 carry the seller's own proof of sale.
- cars left the market, 28 September – 4 October 2026
- 11,499
- Cars, one per vehicle, no listing of them still live on any site Spotlot watches, over the week's 7 days. An exit is not a sale until the seller's own page proves it.
- of them proved sold by the seller's own page
- 5,906
- The seller's SOLD notice, or the page withdrawn: the dealer's word, not ours. The rest left without saying why.
- price cuts, counted once per car per day
- 21,841
- A car repriced down on a day counts once that day, however many listings carried it.
Charts, sized for print and social
Drawn from the issued figures by the same geometry as the report’s own charts, so a card cannot show a line the report does not. Social is 1200 × 630, square 1080 × 1080, print 2400 × 1260 for a half-page at 300 dpi. Each card names its source and its period on its face.


How the figures are made
What Spotlot reads. Australian car dealers’ own websites, every day, under each site’s robots rules and with an honest user agent that names itself. Not the marketplaces: a site that declines automated access is recorded as declining and left alone. The coverage page lists every site read and when.
How it counts. A car is counted once however many advertisements carried it. A car has left the market when no advertisement for it is live on any site watched; it is proved sold only when the seller’s own page said so, with a SOLD notice or the page withdrawn, and every report prints both counts. A price cut is a car repriced down on a day, once that day.
What a change is measured on. Spotlot adds sites over time, so a rise in the whole count can be more coverage, not more market. Every change a report states is measured on the constant panel, the sources watched through both periods, and the week-by-week charts draw the panel in yellow against every site in grey, the band between them being coverage.
The Spotlot same-car ask index. The asking prices of the used cars advertised at both the start and the close of a period, the same car once, value-weighted, chained week on week from 100 on 17 August 2026. It measures what sellers ask, not what buyers pay: no transaction prices are observed.
What is withheld. A day that recorded nothing is a gap, named and never filled in. A figure the record cannot support is withheld with the reason printed in its place, and a state with too few cars behind a share prints the count instead. Nothing is estimated, modelled or forecast. The record began on 14 August 2026; a report named for a period that began before it says so on its cover.
The longer version, on one real car, is at how it works.
Chinese brands, by ownership
The list is printed in every issued report’s Chinese brands section.
Coverage by state
Cars standing on the sites watched at the close of 28 September – 4 October 2026, by the state the advertisement carried, and the period’s exits the seller’s own page proved.
| State | Cars at close | Proved sold |
|---|---|---|
| NSW | 39,081 | 1,229 |
| VIC | 33,750 | 1,405 |
| QLD | 33,129 | 1,354 |
| WA | 22,851 | 769 |
| Not stated | 13,942 | 511 |
| SA | 9,359 | 386 |
| TAS | 4,880 | 199 |
| ACT | 2,079 | 43 |
| NT | 1,675 | 10 |
Every site, with when it was last read and what it gave, is on the coverage page.
About Spotlot, and how to cite it
Spotlot watches the Australian car market from what dealers publish: it reads dealers’ own websites every day and counts what arrives, what leaves and what is cut in price, one car once, with nothing estimated. It issues a weekly, a monthly and a quarterly market report, with half-yearly and yearly reports from 2027, each closed the morning after its period and never rewritten. It is free, funded by donations, with no advertising and no data sold.
Cite a figure as Spotlot, Weekly market report, 28 September – 4 October 2026, with the qualifier that came with it: a count of cars that left is not a count of sales, and a share of exits is not a share of sales. Link the report; each issue has a permanent address and a PDF.
For a figure not on this page, a cut of the data behind one, or a comment: taj@spotlot.io.